METHOD
1. Data acquisition
Various reported quorum sensing interference molecules (633) for various QS systems were selected from large number of literatures, and from several online databases, such as PubChem: https://pubchem.ncbi.nlm.nih.gov/, ChEMBL: https://www.ebi.ac.uk/chembl/, Zinc: http://zinc.docking.org/, and Reaxys: https://www.reaxys.com/#/search/quick. The nine typical receptors, which are SmcR (3KZ9), TraR (1L3L), LasR (2UV0), CviR (3QP1), QscR (3SZT), SdiA (4Y15), PqsR (4JVD), LuxP (1JX6), and LsrB (1TJY), were collected in the Protein Data Bank (PDB) (http://www.rcsb.org/).
2. SMILES-based virtual screening
SMILES strings have not been previously used to indicate similarities among compounds for the task of interaction prediction between AIs analogue and receptors. The specific SMILES-based similarity calculations are based on the edit distance and LINGO.
Edit distance
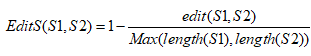
Edit distance is one of the most widely used measures to make comparisons between strings. The edit distance between the two strings S1 and S2 is the minimum number of edit operations, such as insertion, deletion, and substitution, required to convert S1 to S2. Then, the similarity is calculated as,
LINGO
LINGO was developed by Vidal et al., it is based on the fragmentation of SMILES strings into overlapping substrings of a defined size. (n - (q-1)) q-length substring (LINGOs) can be used to represent an n-length SMILES string. It is worth noting that the LINGO profile is only related to the q value of LINGOs and its corresponding occurrence number, does not depend on the order of LINGOs occurrence in a SMILES string. For more details, please refer to the original text of Vidal et al. Then, the similarity based on the LINGOs between S1 and S2 can be calculated as following:
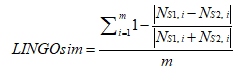
where m is the total number of unique LINGOs created from S1 and S2, while NS1,i represents the frequency of LINGOs of type i in compound S1 and NS2,i represents the frequency of LINGOs of type i in compound S2.
Considering the computational burden and the similarity of 633 molecules themselves, we first carried out the internal similar de-redundant process for 633 ligands. After editing distance was set to be 0.6, a QSIMs collection containing 142 ligands was finally obtained. Basing on the SMILES of 142 QSIMs, we applied the SMILES-based similarity comparation algorithm of Lingo3 to screen the potential QSIMs from the total 1,3880,5608 ligands in the PubChem database. Also after LINGOsim was set to be 0.7, an expanded QSIMs collection containing 73,073 ligands was finally obtained (Fig 1). Finally, we conducted the docking among these ligands and nine typical receptor proteins.
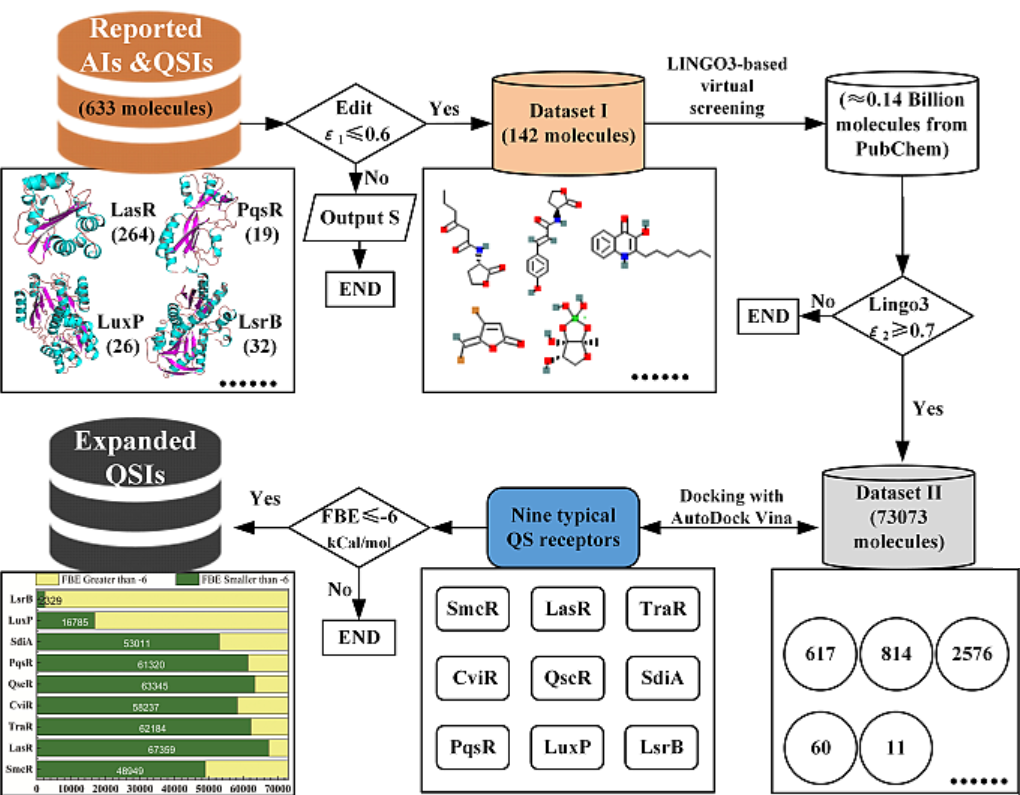
Fig. 1. Schematic diagram for the development of expanded virtual library of potential active QSIMs
3. Docking validation and prediction by AutoDock Vina
Just as the Fig 2. illustrated, water molecules and complexed ligands were removed from the protein structures of nine typical receptors by Pymol, after which hydrogen atoms were added, atoms were set to be Assign AD4 type, and KOLLMAN charges, with the protonation state of the individual residues being taken into account during charge assignment with the help of AutoDockTools. Similarly, ligands here, which are consists of QS signals, relevant QS agonists, and QSIMs of these nine receptors, need to be converted into different file formats, such as sdf, pdb, and pdbqt, with the help of a variety of softwares (Open babel, Raccon or AutoDockTools).
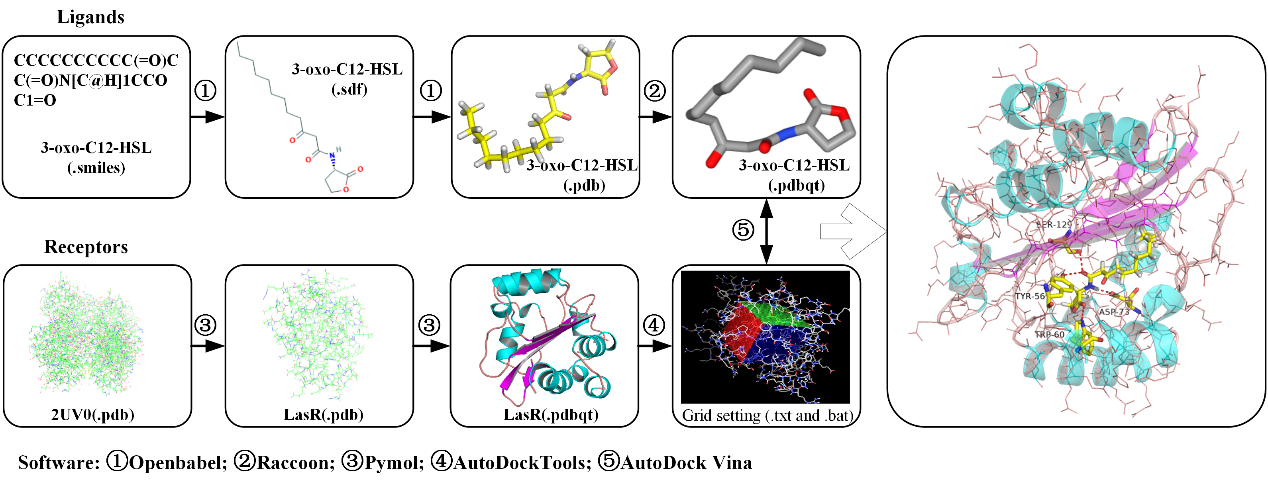
Fig. 2. The flowsheet for dealing with receptors and ligands
4. Protein pockets similarity definition
According to the distribution of docking FBEs, we proposed a definition to express the similarity between different protein pockets, which is stated as following:
Where x, y represents for different proteins pockets, such as AIs binding pocket of LasR and TraR. The pocketeditx,y is the similarity between different protein pockets. Nx, Ny are the number of ligands that can bind to x and y proteins, respectively. and Nxy is the number of ligands that can bind to both x and y protein pockets.
RESULT
1. Reported QSIMs
Based on a large number of literatures and various databases, 633 active small molecules for QS have been reported based on various receptor proteins, LuxR (254), LasR (275), TraR (67), CviR (19), RhlR (28), LuxN (6), PhzR (8), QscR (15), PqsR (25), LuxP (42), LsrB (50) and some other receptors (45). The specific distribution of QSIMs is shown in Figure 3a. SmcR (LuxR) from V. vulnificus and LasR from P. aeruginosa are the main targets of the reported active small molecules. TraR (R. radiobacter), LsrB (S. typhimurium) and others followed. Just as listed in our database and Figure 3b, plenty of (12.48%) naturally occurring QSIMs have been reported from many organisms. The development of synthetic QSIMs with interference from AHL type QS is mainly focused on modifications in the AHL side chain and the AHL ring moiety, which are 31.91% and 35.55% in our database, respectively. Totally, according to the development and screens by various researches for potential ligands which have some interference on various QS system, AHL type ligands accounts for the majority (71.57%), followed by AI-2 analogues (13.43%) and Natural QSIMs and PQS analogues (2.53%).
The molecules we have collected include QS agonists and QS antagonists. Here, just as illustrated in Fig 3c, there are 267 QS antagonists and 62 QS agonists which have specific IC50 values and EC50 values, respectively, in our reported QSIMs virtual library. And there are 21 molecules that can act as both QS agonists and QS antagonists for different regulatory proteins. To better understand these QSIMs crosstalk among various receptors, we chose to analyze the QSIMs distributions of five proteins (LuxR, LasR, TraR, LuxP, and LsrB), and the results were shown in the Venn diagram (Fig 3d).
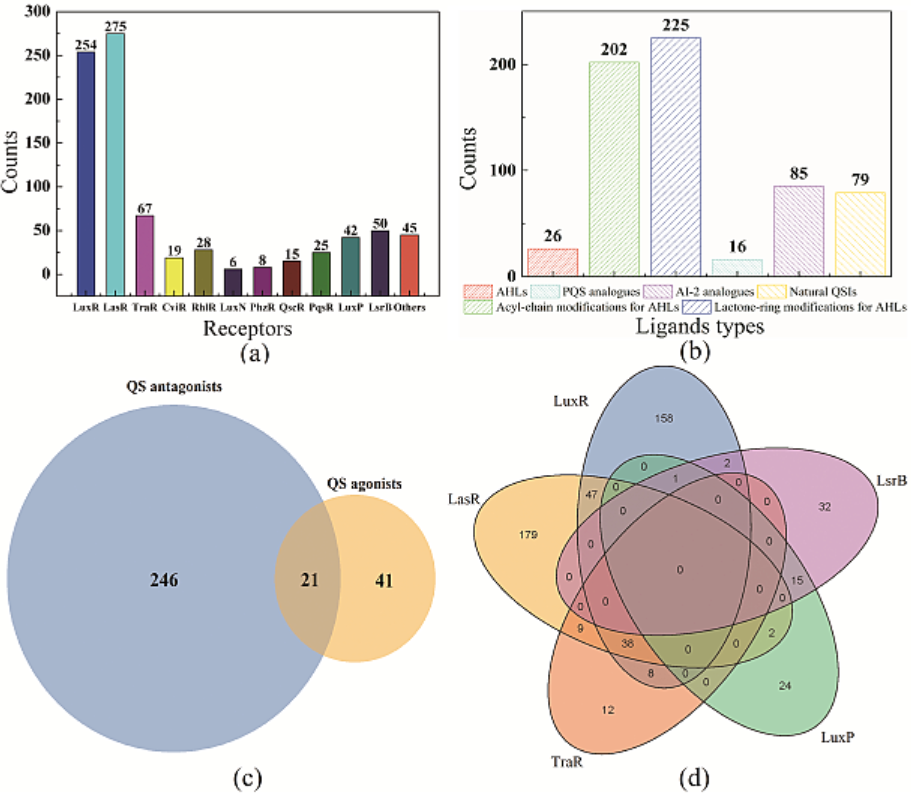
Fig. 3. Statistics of the reported QSIMs
2. Potential QSIMs
The docking result for potential QSIMs and SmcR (LuxR), TraR, LasR, CviR, QscR, SdiA, PqsR, LuxP, and LsrB nine typical receptor proteins have been illustrated in Fig 4. We know that the smaller the free binding energy (FBE) is, the stronger the interaction between ligand and protein is, which means that these ligands have more potential to be QSIMs. As for the SmcR, there are 4.15% ligands have FBE which is smaller than -8 kCal/mol, while that for LasR, TraR, CviR, QscR, SdiA and PqsR are 61.14%, 41.31%, 25.88%, 39.5%, 33.79% and 11.07%, respectively. And FBEs (≤-8 kCal/mol) for LuxP and LsrB are 0.09%, and 0%, which is much smaller than that of the above seven proteins. For the FBE being greater than 0 kCal/mol (nonworking for QSI function), LsrB ranks first (54.37%), followed by LuxP (22.52%), SdiA (9.96%), CviR (1.59%), TraR (1.56%), QscR (0.92%), PqsR (0.01%).
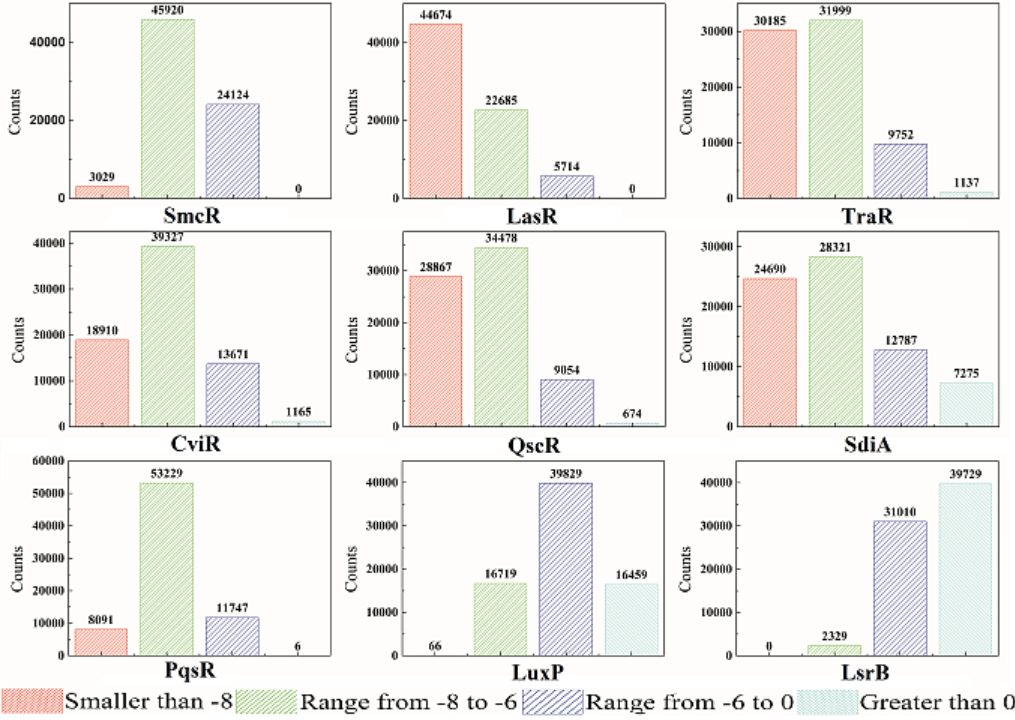
Fig. 4. FBE results and distributions for the expanded ligands and nine typical receptors.
3. The FBEs for various expanded ligands
We further analyzed the FBEs of nearly expanded 73,000 screened ligands with nine receptors. We sequenced the FBEs of each protein and 73,000 screened ligands, and identified the ligands that bind most strongly to each protein. the FBEs of these ligands and the other proteins have been also listed in Fig. 5. The strongest binding and typical binding for SmcR, TraR, LasR, CviR, QscR, PqsR, SdiA, LuxP, and LsrB are 56324809, 101018536, 3424041, 20279703, 109057410, 118004297, 13782492, 131400990, 45084042. The FBE distribution of the LuxP and LsrB is quite different to the other seven receptors. The specific binding details of each protein and the corresponding strongest binding ligands were shown in Fig 5 around.
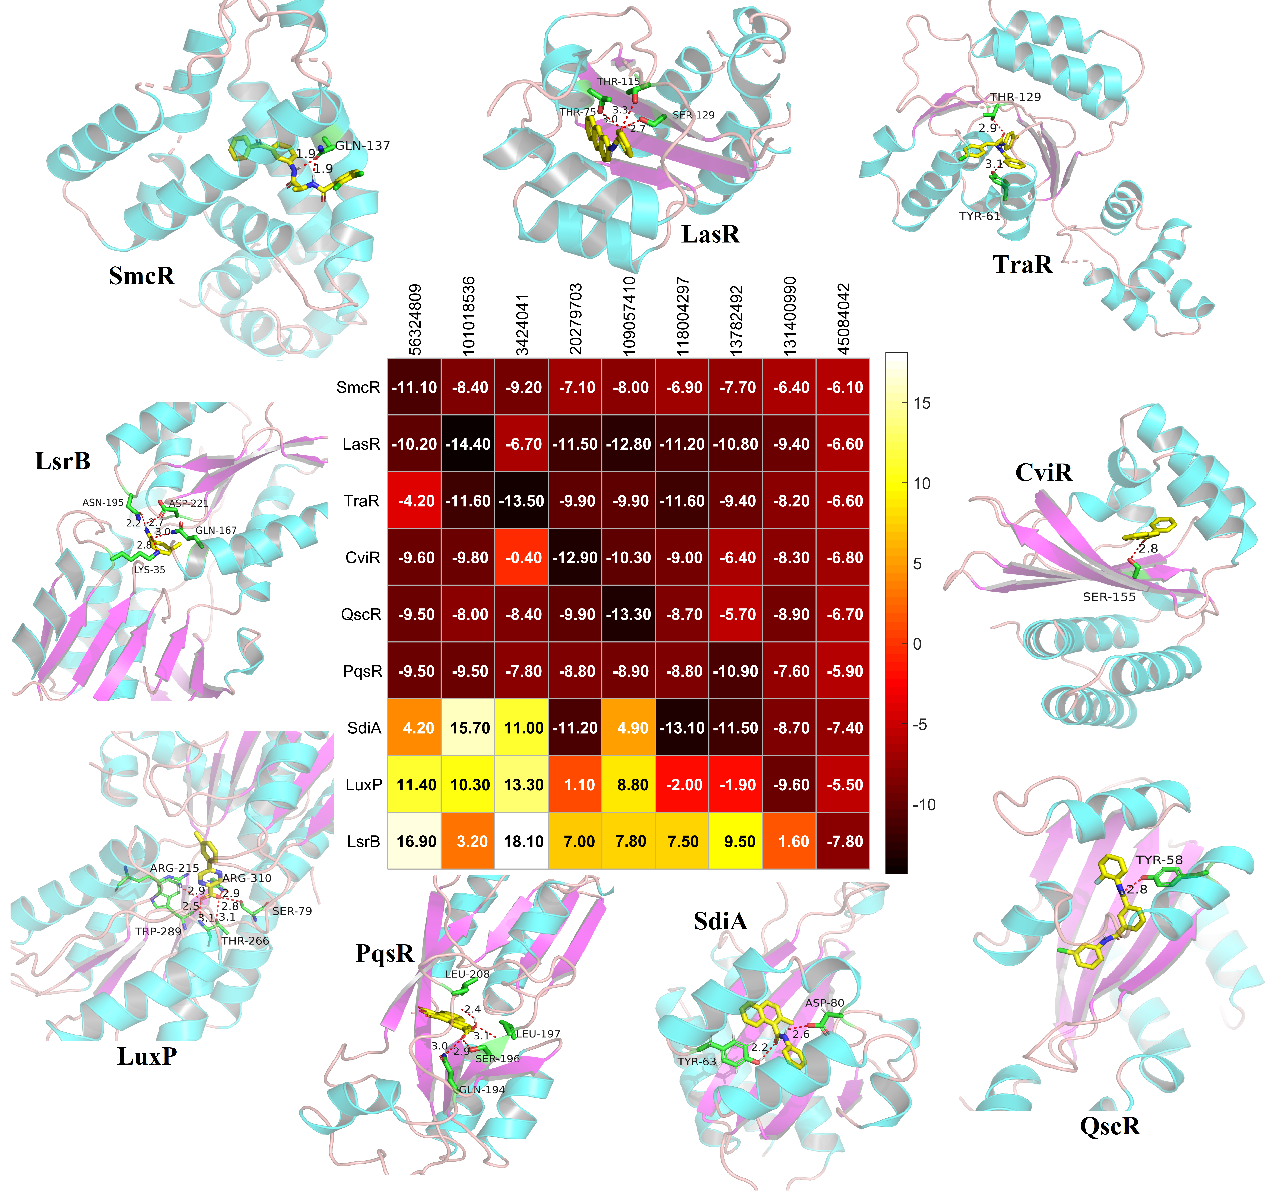
Fig. 5. Typical and the strongest binding FBEs results for the screened nine ligands and receptors.
4. Protein pockets similarity
To analysis and discuss the protein binding pocket similarity, we first counted the potential QSIMs for each protein, as shown in Fig 6a. LasR leads the nine proteins with 67359 potential active ligands (FBE smaller than -6 kcal/mol), followed by QscR (63345), TraR (62184), PqsR (61320), CviR (58237), SdiA (53011), SmcR (48949), LuxP (16785) and LsrB (2329). And then based on pocketeditx,y, we have calculated the number of ligands binding nine proteins by pairwise. The results of pocketeditx,y for various pairwise are shown in Fig. 6b. We can clearly find that LuxP and LsrB are less similar to other proteins.
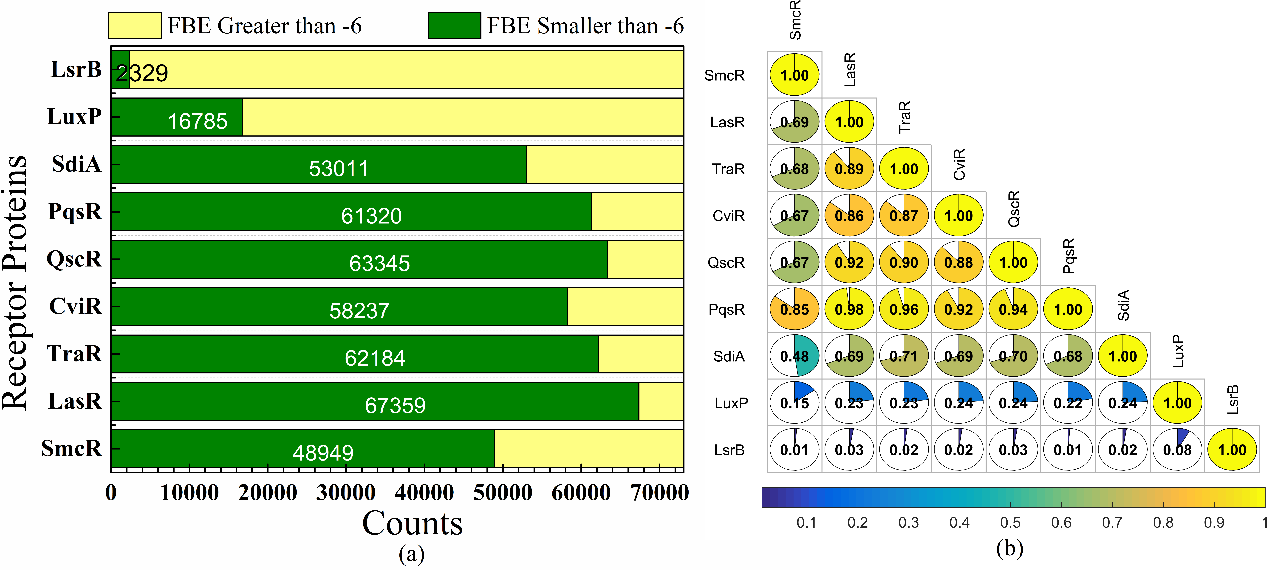
Fig. 6. The analysis and discussion for the receptors binding pockets similarity.